Linux - Monitoring processes
Published on

Contents
Introduction
Systems Monitoring is in charge of continuously monitoring different resources and services of the computer, to guarantee the required level of availability and alert administrators in case of failure.
To know the behavior of the system it is necessary to obtain information of the different subsystems that compose it.
Linux has a series of commands that provide data on the performance of the hardware and the operating system.
Depending on the type of information they present, they can be classified into:
- Processes: Displays information about the processes that are running on the system.
- System processes: Those executed by the kernel, www, mail, etc. and daemons.
- Administrator processes
- User processes
- Storage: Provides information about input and output to the storage subsystem.
- Memory: They provide information about real and swap memory space.
- Network: Provides statistics on the use of network interfaces.
- Versatile: They show information about different subsystems of the computer.
Processes
Attributes
- PID: “Process ID”. When the process is created, is assigned an integer number which is unique.
- PPID: “Parent Process ID”. Identifies the parent process which forked to create the actual process.
- Nice number: This number assigns the priority to a process.
- tty: Terminal to which the process is connected.
- RUID: “Real User ID”. ID of the user that issued the command.
- EUID: “Effective User ID”. Determines with whose privileges that process runs.
- RGID: “Real Group Owner”. ID of group that issued the command.
- EGID: “Effective Group ID”. Determines with whose privileges that process runs.
SUID (Saved User ID) is a User ID which is taken by any process before execution even though the script is executed by someone else.
Example:
If X is the owner of the script and Y tries to run the same script, the script runs with the ownership of X.
/etc/passwd file stores users; one of the users attributes is a User Identifier and another is the Group Identifier.
Classification
By schedule:
- Periodic: Cron, Systemd timers, etc.
- Non-periodic: They are executed once at a specific time.
Or:
- Foreground: The process that is interacted by the user.
- Background: They are set with “CTRL + Z” or with the
&and they are retrieved withfg. They have a higher value of nice and therefore less priority.
With jobs we can see the status of the tasks.
Priorities - nice
When you know that a process can run with a lower priority, you can alter it with nice. The program will then have a smaller portion of the CPU and will have less impact on other running processes.
nice works with levels:
- Positive levels (1 to 19) progressively lower the priority.
- Negative levels (-1 to -20) increase the priority. Root is the only one capable of assigning negative numbers.
Console users have zero priority by default.
To check the nice value: ps -xl
The dynamic priority of the process is calculated based on the nice number. Along with the CPU consumption performed. P = min + nice + (0.5 * recent)
To alter the priority of a process:
# nice -n command
nice -20 hydra
If if the command has already launched, nice has to be set again:
# renice n command
renice -20 bash
Life cycle
The process life cycle is shown in the image below.
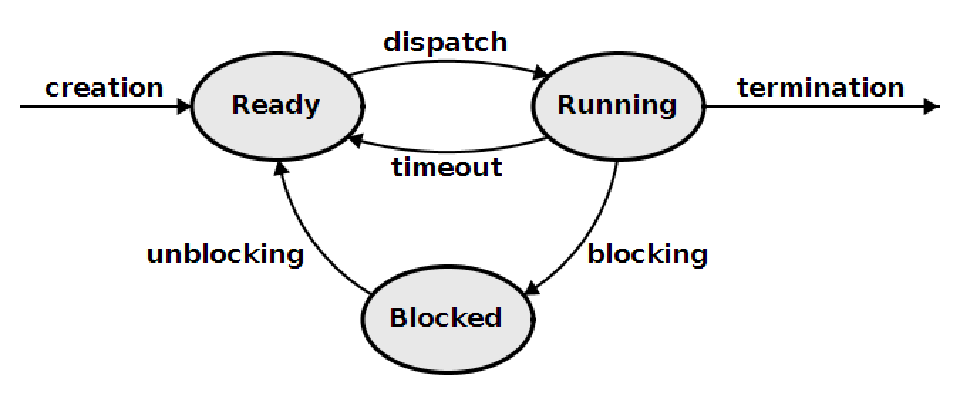
Planning Algorithms are in charge of distributing the resources and expropiate them if needed.
I may make a post about Operating System Planning Algorithms to explain furthermore the image above.
In short:
- A process is created as a fork from another process or from Init.
- Can be blocked if is accessing a resource that another process (with more priority) needs.
- Can be terminated either by the OS or by a user, both with a signal (i.e: SIGKILL or SIGTERM).
POSIX Signals
kill, killall and pkill are programs that are able to send signals to processes.
kill -n PID1 PID2 # where n is the number of the signal and PID is the identifier of the process
killall -s SIGTERM myProgram
pkill --signal SIGTERM myProgram
Signals:
| SIGBUS | N/A | Terminate (core dump) | Access to an undefined portion of a memory object |
|---|---|---|---|
| SIGCHLD | N/A | Ignore | Child process terminated, stopped, or continued |
| SIGCONT | N/A | Continue | Continue executing, if stopped |
| SIGPOLL | N/A | Terminate | Pollable event |
| SIGPROF | N/A | Terminate | Profiling timer expired |
| SIGSTOP | N/A | Stop | Stop executing (cannot be caught or ignored) |
| SIGSYS | N/A | Terminate (core dump) | Bad system call |
| SIGTSTP | N/A | Stop | Terminal stop signal |
| SIGTTIN | N/A | Stop | Background process attempting read |
| SIGTTOU | N/A | Stop | Background process attempting write |
| SIGUSR1 | N/A | Terminate | User-defined signal 1 |
| SIGUSR2 | N/A | Terminate | User-defined signal 2 |
| SIGURG | N/A | Ignore | Out-of-band data is available at a socket |
| SIGVTALRM | N/A | Terminate | Virtual timer expired |
| SIGXCPU | N/A | Terminate (core dump) | CPU time limit exceeded |
| SIGXFSZ | N/A | Terminate (core dump) | File size limit exceeded |
| SIGWINCH | N/A | Ignore | Terminal window size changed |
| SIGHUP | 1 | Terminate | Hangup |
| SIGINT | 2 | Terminate | Terminal interrupt signal |
| SIGQUIT | 3 | Terminate (core dump) | Terminal quit signal |
| SIGILL | 4 | Terminate (core dump) | Illegal instruction |
| SIGTRAP | 5 | Terminate (core dump) | Trace/breakpoint trap |
| SIGABRT | 6 | Terminate (core dump) | Process abort signal |
| SIGFPE | 8 | Terminate (core dump) | Erroneous arithmetic operation |
| SIGKILL | 9 | Terminate | Kill (cannot be caught or ignored) |
| SIGSEGV | 11 | Terminate (core dump) | Invalid memory reference |
| SIGPIPE | 13 | Terminate | Write on a pipe with no one to read it |
| SIGALRM | 14 | Terminate | Alarm clock |
| SIGTERM | 15 | Terminate | Termination signal |
Table from Wikipedia
Signals in italic-bold are some I’ve encountered while doing Operating System projects for University.
To modify a signal in Bash to do something else check this post. In other shells like ZSH is different.
Planning of a command
at
Contrary to cron which runs periodically, at runs occasionally when the user sets it. In other words, to program a set of commands to run at a certain hour we can use at.
It’s not persistent, so a reboot will delete the actual timer.
at package comes with:
atatq(queue) - Lists the user’s pending jobs. If ran by root, everybody’s jobs are listed.atrm(remove) - Deletes jobs by their job number.batch- Executes commands when system load levels (default 1.5) permit it.
Parameters:
-m: Send mail to the user when the job has completed even if there was no output.-f: Reads the job from file rather than standard input.-t: Submit the job to be run at the time specified. Best with-f.
at accepts times of the form:
HH:MM(If that time is already past, the next day is assumed.)midnight,noon, orteatime(4pm).5AMor7PMfor running in the morning or the evening.MMDDYYorMM/DD/YYorDD.MM.YYorYYYY-MM-DD.now + count time-units, where the time-units can be minutes, hours, days, or weeks.- You can tell
atto run the job today by suffixing the time withtodayand to run the job tomorrow by suffixing the time withtomorrow.
- You can tell
Example
First run at daemon: systemctl start atd
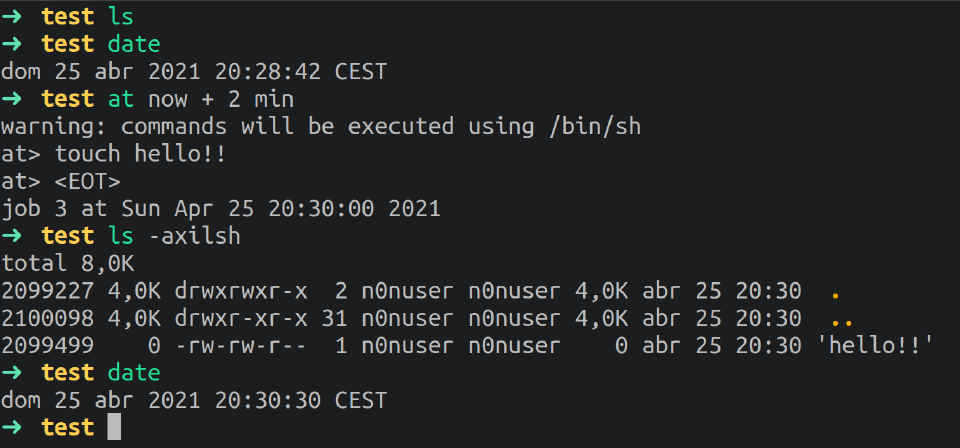
As you can see in the image above, running at enters in a interactive console where commands are executed line by line much like a Bash script. To exit the interactive console we can press CTRL + D.
nohup
Run a command immune to hangups, with output to a non-tty.

cron
Daemon to execute scheduled commands (Vixie Cron)
To edit crons: crontab -e
I’ll later explain it with all the details here.
Monitoring Processes
The purpose of monitoring is to ensure that the system works correctly and to minimize the downtime of service. The time spent detecting an incident is critical because taking a long time to detect the failure, will make it even more difficult for us to solve it.
Commands:
CPU
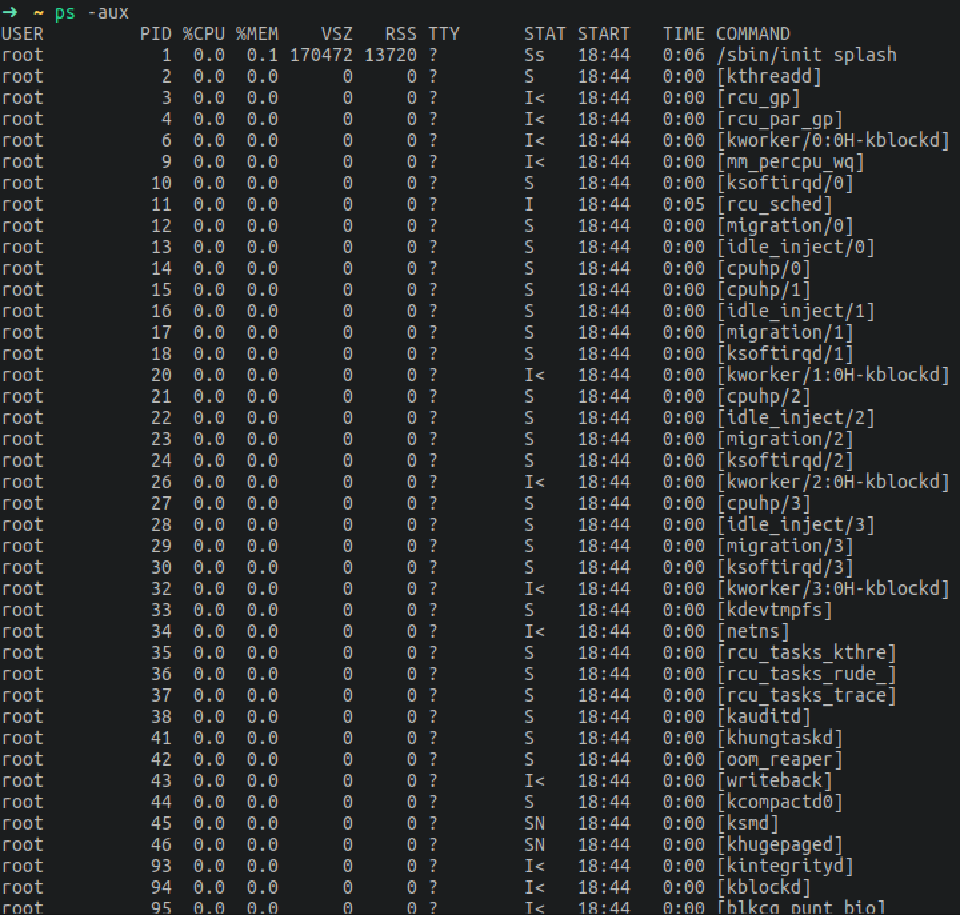
ps
Report a snapshot of the current processes. An always go-to that is usually piped with grep and/or other tools like awk and sed.
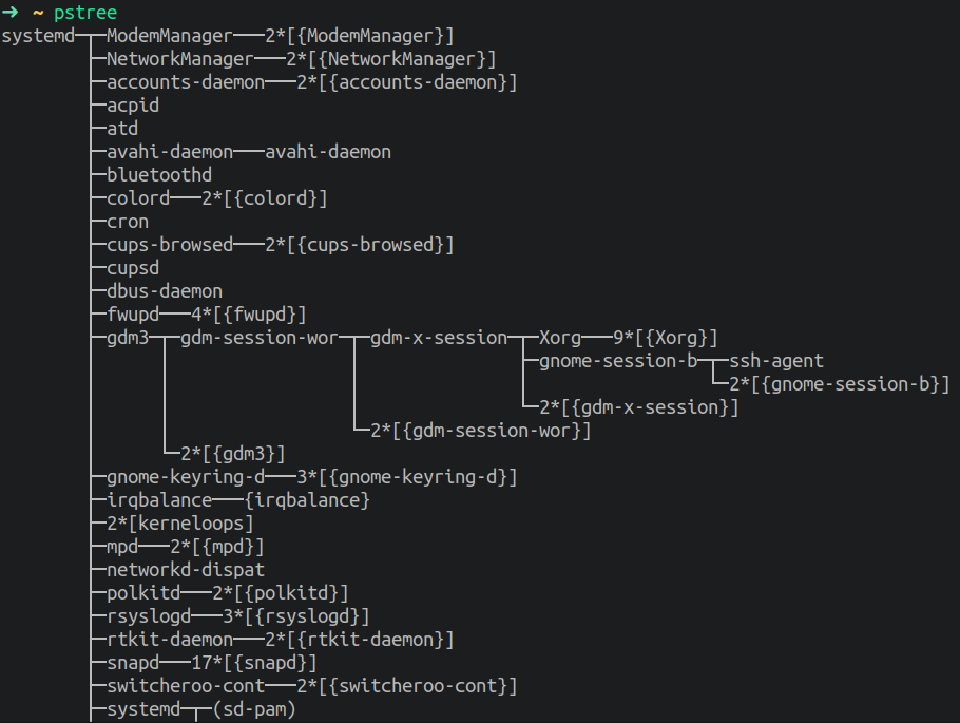
pstree
Display a tree of processes.
uptime
Tell how long the system has been running.

Storage
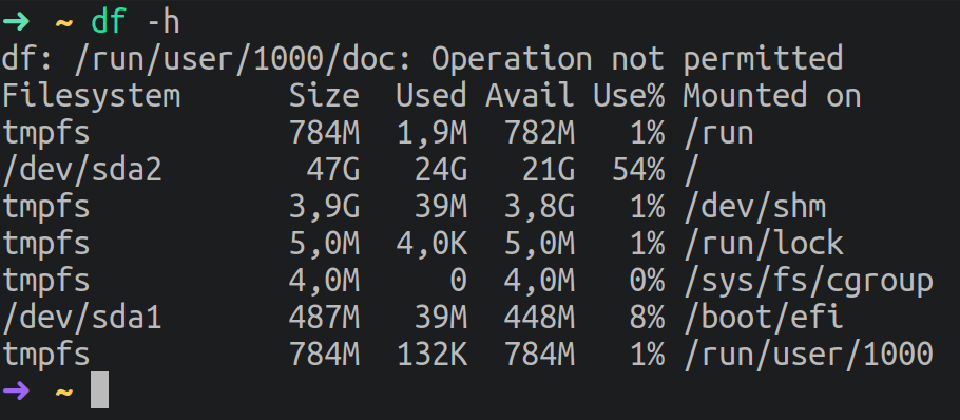
df
Shows disk space, mounted file systems, and free space.
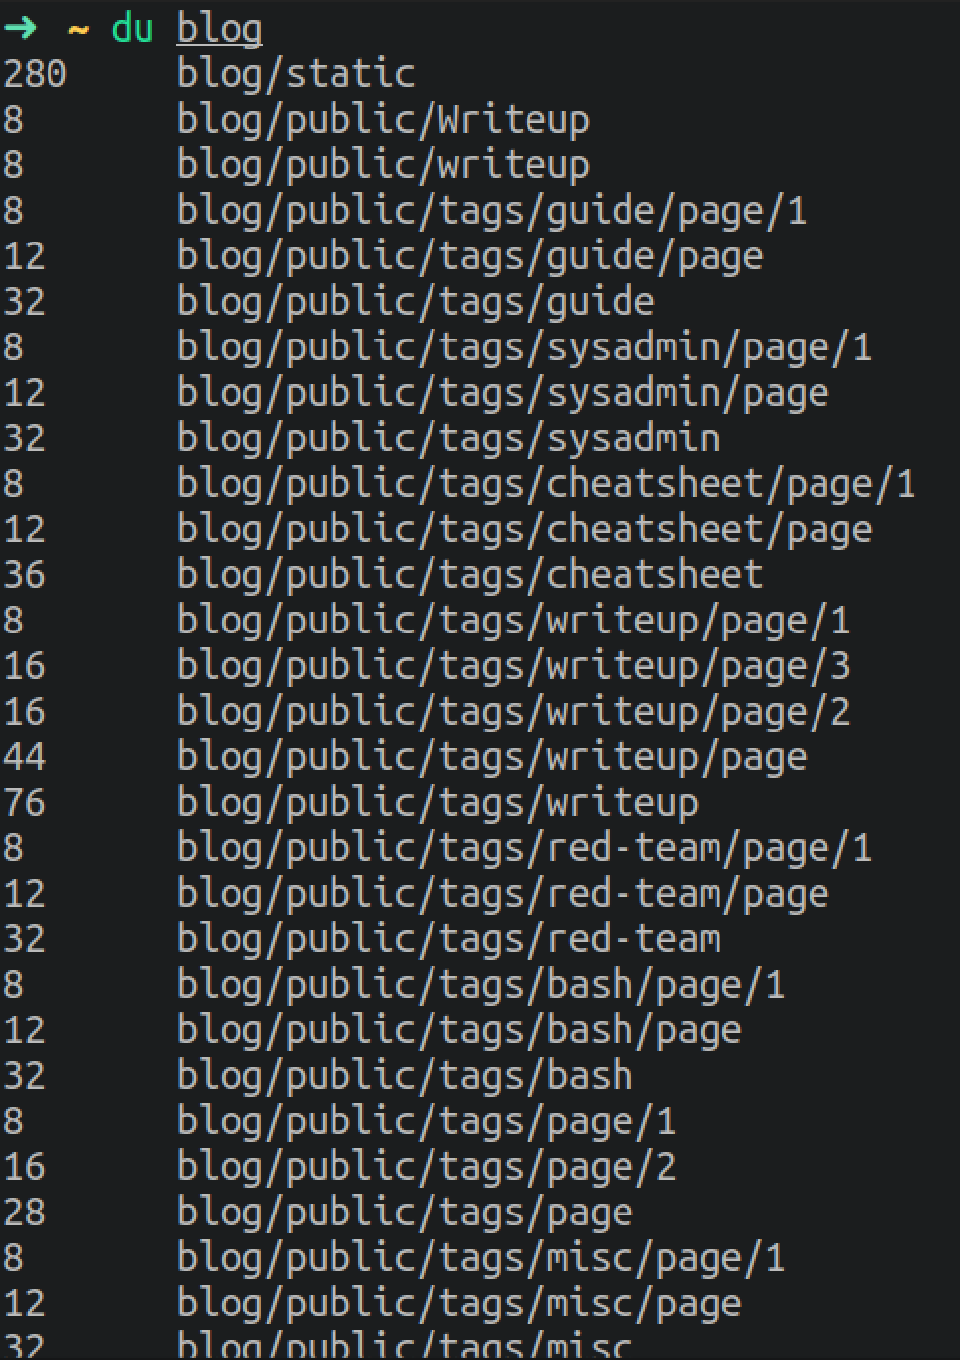
du
Estimate file space usage of a filesystem.
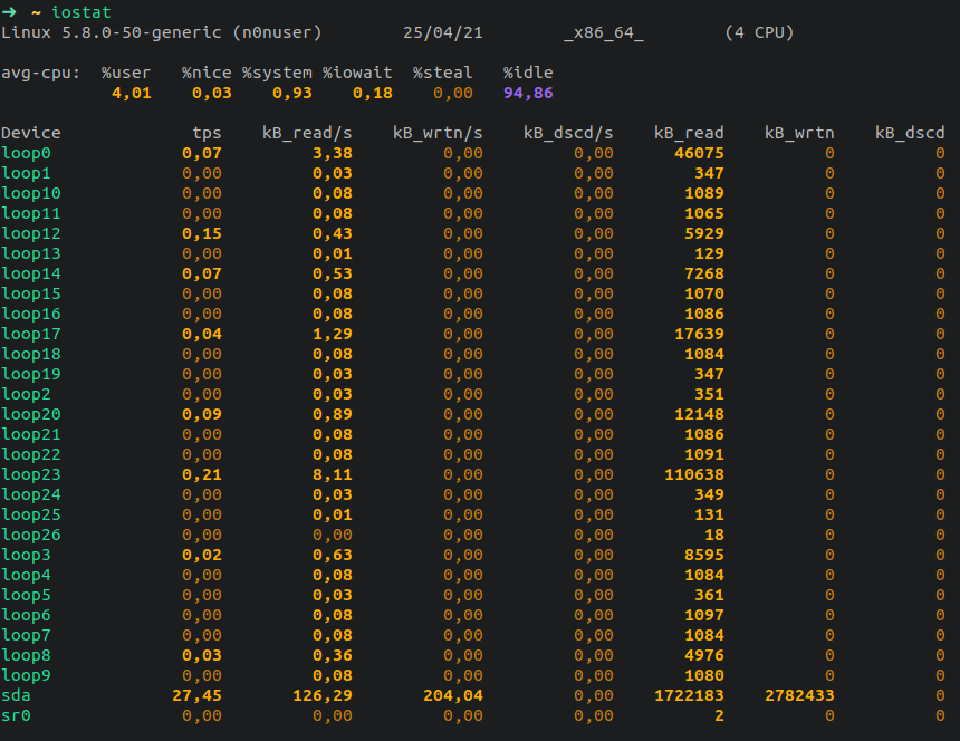
iostat
Report Central Processing Unit (CPU) statistics and input/output statistics for devices and partitions.
sudo apt install sysstat -y
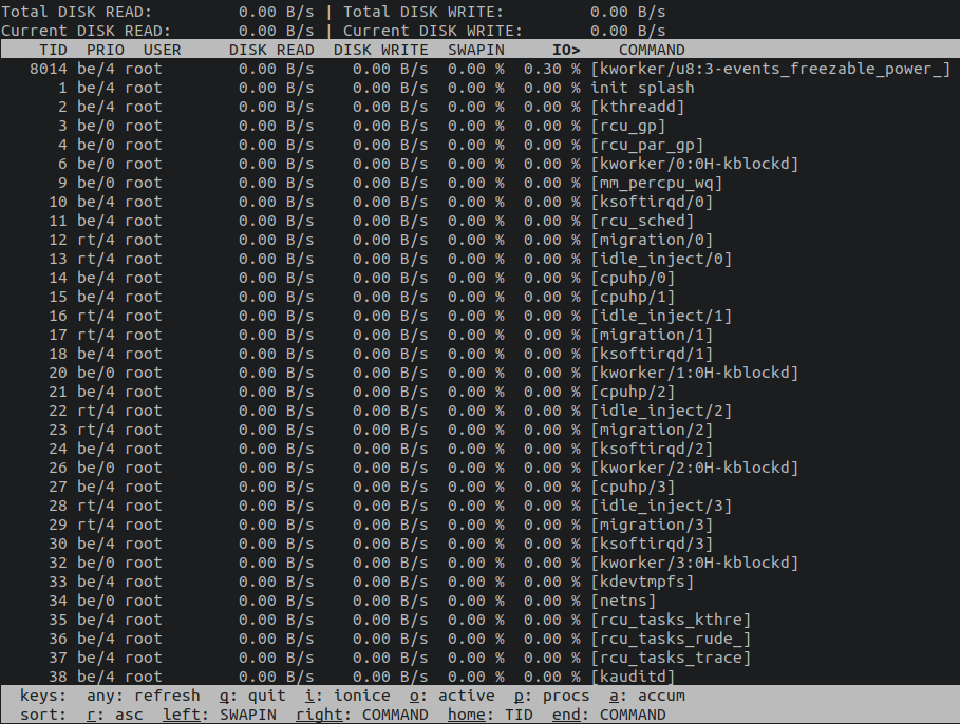
iotop
sudo apt install iotop -y
Memory
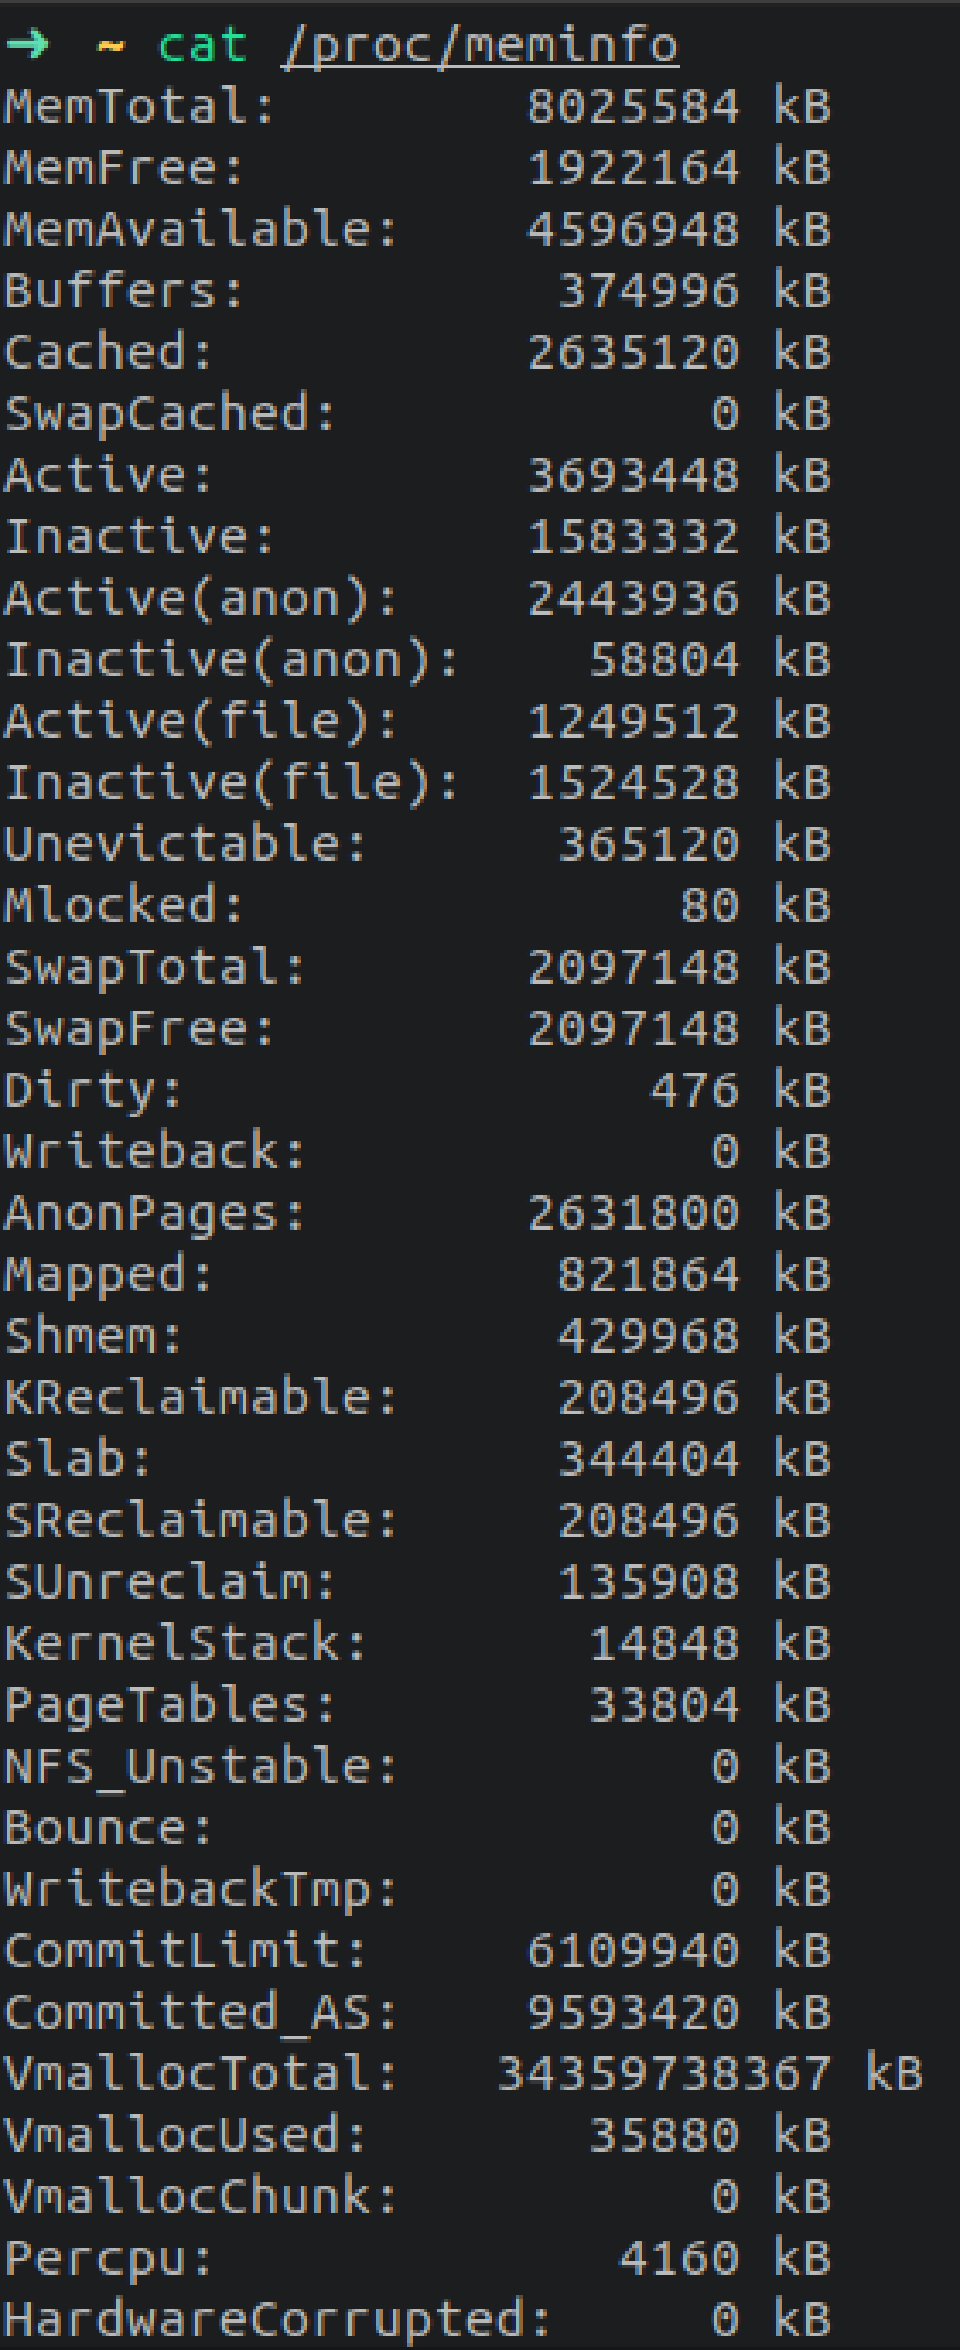
meminfo
cat /proc/meminfo
free
Display amount of free and used memory in the system

vmstat
Report virtual memory statistics.
sudo apt install sysstat -y

Network
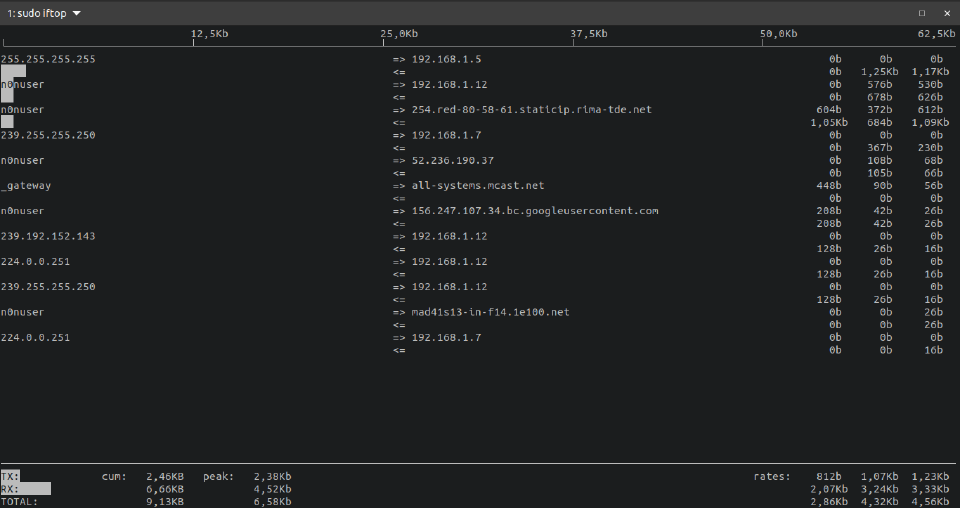
iftop
Display bandwidth usage on an interface by host.
sudo apt install iftop -y
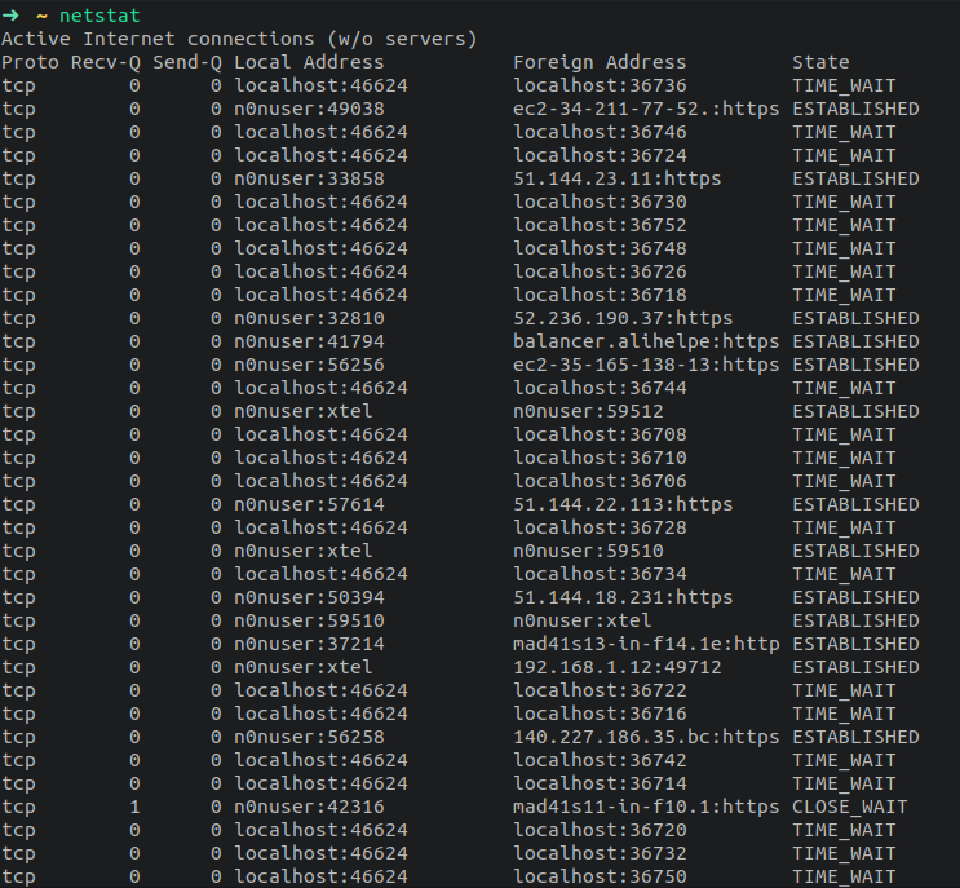
netstat
Print network connections, routing tables, interface statistics, masquerade connections, and multicast memberships.
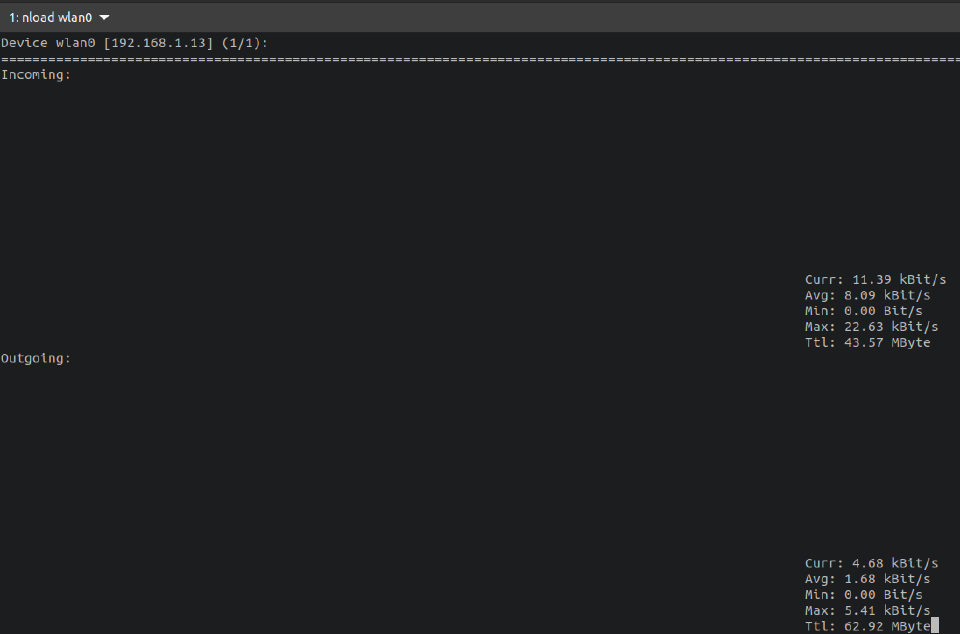
nload
sudo apt install nload -y
nethogs
sudo apt install nethogs -y

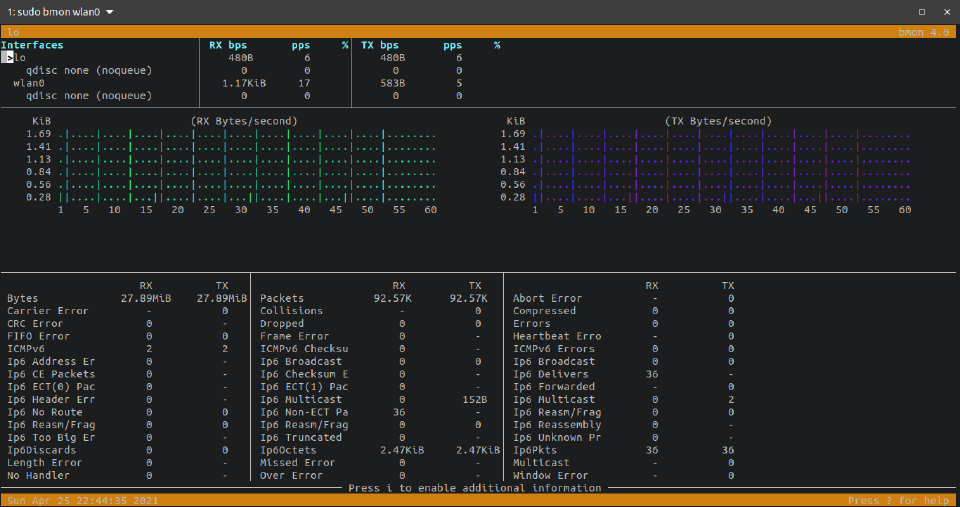
bmon
sudo apt install bmon -y
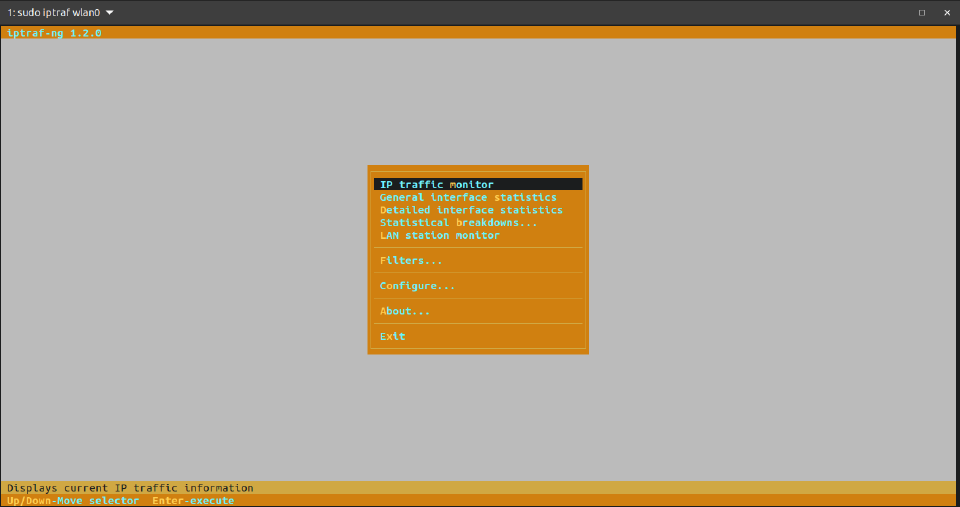
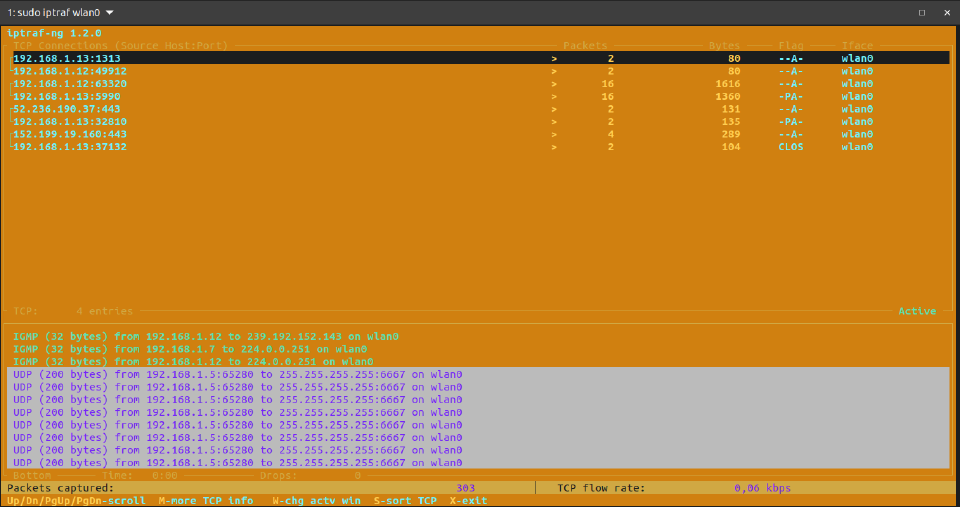
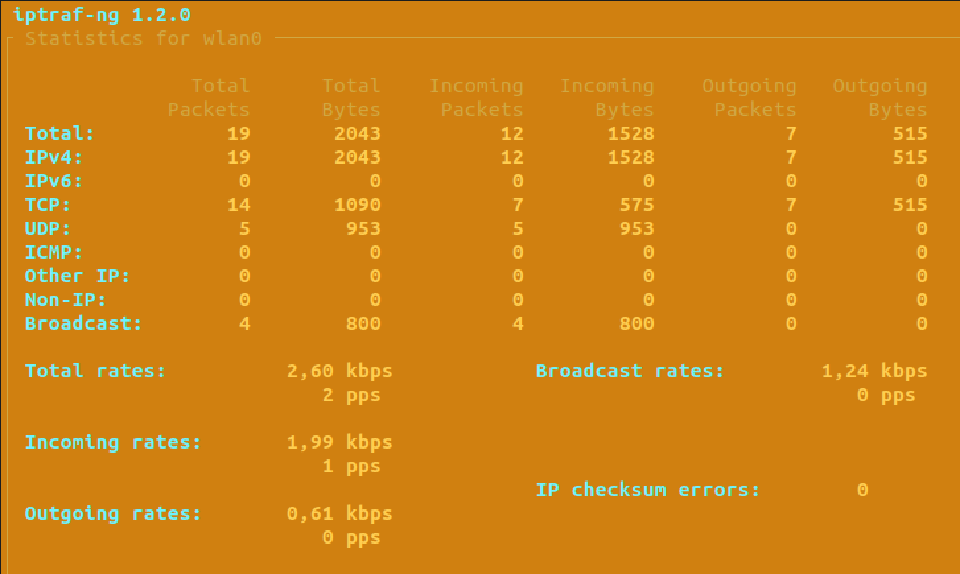
iptraf
sudo apt install iptraf -y
cbm
sudo apt install cbm -y

Versatile
w
Show who is logged on and what they are doing.

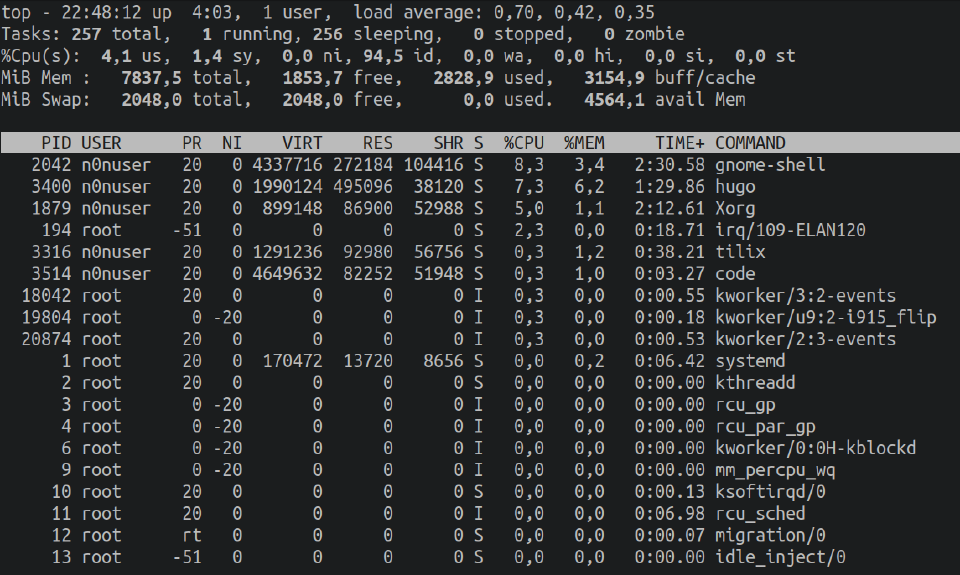
top
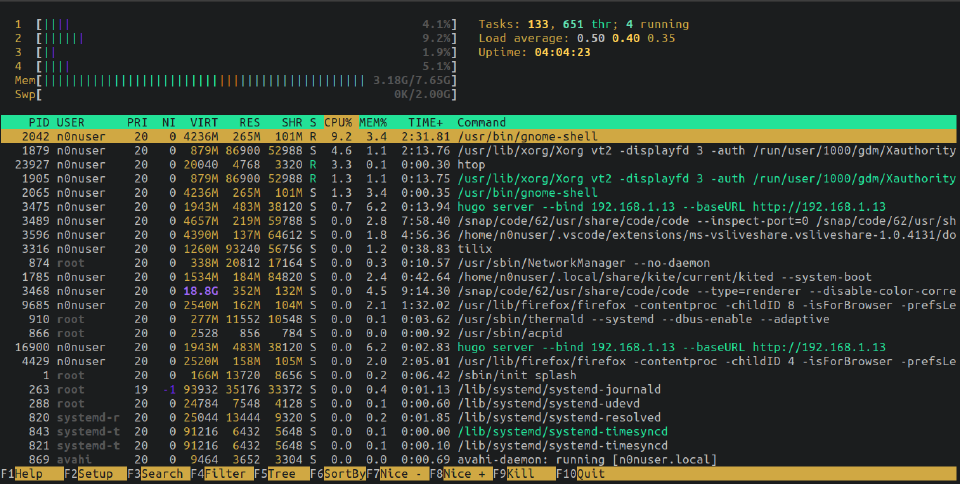
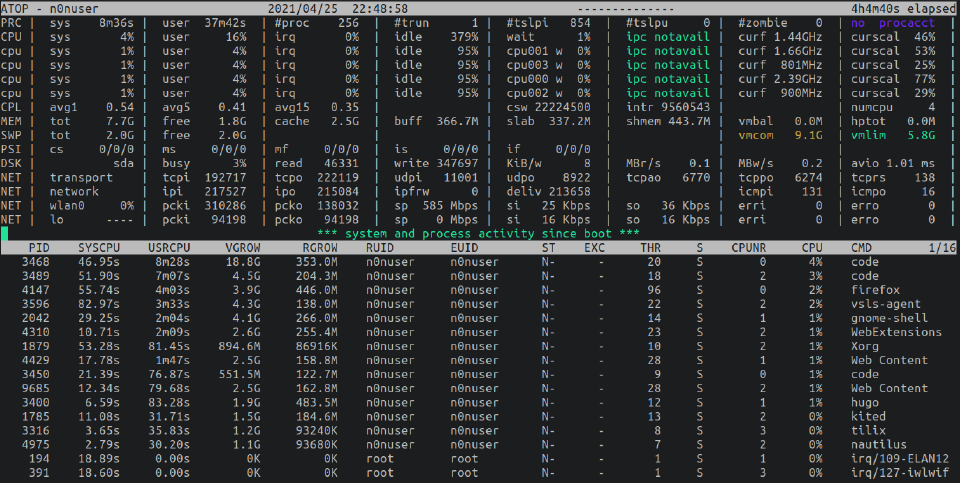
top, htop (same as top but with better UI) and atop are the swiss knife of System Administrators.
sudo apt install htop atop -y
States of a process:
- S (sleeping): process running but not active at the moment, or waiting for some event to continue.
- R (runnable): running process.
- T (sTopped): process completely stopped, but can be restarted.
- D (swapped): the input/output device is ready to be executed but is in swap memory because it may not have enough memory.
- Z (zombie): a child process that has ended but the parent has not waited for it (wait). It is terminated and does not reside in memory, but it is still allocated certain kernel resources and cannot be removed from the system. All zombies will be adopted by Init who will remove them from the system.
top:
htop:
atop:
sar
Collect, report, or save system activity information.
A guide on sar in LinuxHint page.
mpstat
Report processors related statistics.
sudo apt install sysstat -y

Advanced tools
- Nagios
- Monit
- PandoraFMS
- Zabbix
- Big Brother (very old)
C programs to test monitoring skills
Eats CPU
int main()
{
  while(1);
}
Eats RAM
#include <stdio.h>
#include <stdlib.h>

int main(){
  int i;
  char *p1, *p2;
  p1 = (char *) malloc(1000000000);
  while(1){
    p2 = p1;
    for(i = 0; i < 1000000000; i++) *p2++ = 'a';
  }
}
Eats Disk space
#include <stdio.h>
#include <ftw.h>
#include <sys/types.h>
#include <sys/stat.h>
#include <fcntl.h>
#include <unistd.h>

int copy(const char* name, const struct stat *state, int value)
{
  int fd;
  char *buf[1];
  if (value == FTW_F){
    fd = open(name, O_RDONLY);
    if (fd == -1)
      return 0;
    //Reads char by char
    while(read(fd, buf, 1) > 0)
      close(fd);
  }
  return 0;
}

int main(int argc, char **argv)
{
  ftw("/usr", copia, 20);
}
Sleeping process
#include <stdio.h>
#include <stdlib.h>

int main(){
  while(1)
  {
    printf("I'm sleeping for 30 sec.\n");
    sleep(30);
    printf("My head hurts, imma sleep again.\n");
  }
}
Test
Compile those C files and:
- Launch CPUeater. You won’t be able to do anything as it’s in foreground and consuming all the CPU.
- Press CTRL+Z to leave it in the background and then kill it.
- Launch some Sleeper instances with
&.- Check background apps with
jobs. Usefgandbgto interact with them.
- Check background apps with